


Introduction
What if the most complex and beautiful patterns in nature could be created from a very simple equation? This is what fractals give us. Fractals are exciting because they’re at the intersection of math, nature, and art. There is infinite complexity in a simple math equation. Fractals are everywhere in nature, from vegetables like broccoli, your lungs, and even inside your phone! First introduced to the world by mathematician Benoit B. Mandelbrot. Fractals show us that some of the most complicated things in nature come from very simple equations.
What Are Fractals?
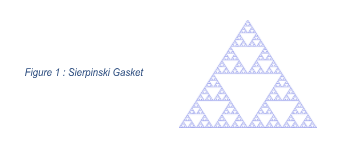
Fractals can be categorized into two different categories: Self-similarity and the Hausdorff Dimension. People often use the phrase “zoom in effect” as a synonym for self-similarity. In fractal geometry, the same shape presents itself indefinitely, whether you zoom in or out. An example of this is if you look at the Sierpinski Gasket and zoom in on it, you are seeing the same fractal pattern, as if you’re in a never-ending loop. This is an example of exact self-similarity. Exact self-similarity is what you see when you create a fractal with an equation; statistical self-similarity is what you see in nature. There’s also a difference between standard geometry and fractals. Another way this can be explained is that standard geometry is “smooth” and fractals are “rough”. If you were to measure a coastline and use a standard one-foot-long ruler, you would get an inaccurate distance. If you were to use a smaller ruler, then your distance would increase and become more accurate as your ruler decreases in size.
This is called the Coastline Paradox. Fractals are described as rough because, unlike regular shapes such as a circle with a smooth edge, fractals have no edge. The roughness keeps on as you keep zooming in. Fractals are among the most complex geometric topics, with non-integer dimensions and greater depth.
Who is Benoît B Mandelbrot?
Benoît B. Mandelbrot (1924–2010) was a Polish-born French-American mathematician known as the “father of fractal geometry”. Mandelbrot created the term “fractal” to describe self-similar, complex shapes found in nature, such as coastlines, trees, and seashells, and later developed the Mandelbrot set. Working at IBM and Yale, he revolutionized mathematics by applying chaos theory and geometry to the math world and the real world. The Mandelbrot family was important in Benoit’s life. The male contingent was especially important to him, especially his uncles. Over the years, his father and mother struggled and worked as most parents did. His uncle, Szolem, had a PhD in mathematics, which saved his family by moving them to France. This affected the rest of his mathematical direction. The move of the Mandelbrot family to France, Paris, happened in 1936, in the early stages of conflict beginning to arise in Europe. And Mandelbrot and his family were lucky to survive because he was Jewish, and it was rare during World War II.
Due to the chaos of World War 2, Mandelbrot didn’t grow up going to school. Instead of memorizing formulas and writing essays, Mandelbrot spent most of his time with his uncle, Szolem, who taught him by playing chess, looking at maps, and using visual learning. He became obsessed with studying the sizes of countries, coastlines, and continents, which later led him to his famous question, “How long is the coast of Britain?” Because Mandelbrot didn’t have the traditional training, he was taught to take complex equations and formulas into pictures in his mind. He even once said he could “see” the solutions as geometric shapes before he ever wrote down the algebra. This showed how his thinking was way ahead of his time. Eventually, Mandelbrot finally attended a college at École Polytechnique in France. And what made his college years so challenging was that his professors at the time strictly believed in pure formulas. Moreover, his uncle wanted him to major and study in pure analysis, which was dry, heavy, and didn’t require any visual thinking. His uncle Szholem was a member of Bourbaki. It was a group of famous mathematicians who hated visual math.
In 1985, Mandelbrot made one of the biggest decisions of his life: He quit his job at the University and decided to work at IBM. Most people back in the day didn’t have access to computers and advanced technology. At IBM, Mandelbrot was among the first people to use a computer. And while experimenting, he used the computers to create the very first fractal images. Using these computers, the ” Mandelbrot Set ” was created. If Mandelbrot hadn’t made these images, the Mandelbrot set would have been just a set of boring numbers and equations that no one could see.
This visualization was a massive change; previously, another mathematician, Gaston Julia, had done the same thing, except he never made them into images. And could only guess what the fractal looked like. Mandelbrot made a significant impact on the fields of math and geometry. By the time he started teaching again at Yale in 1987, he had real proof that not all shapes in the universe were just soft, smooth shapes- but beautiful, rigid shapes.
Mandelbrot’s Discovery of Fractal Geometry
Using his discovery of fractals, Benoît B. Mandelbrot began his studies with a question: how long is the coast of Britain? This was derived from his love of geography and maps. Mandelbrot discovered that a coastline’s length depends on how closely you look at it. In other terms, a coastline could be infinite if you look at it on an atomic level. He discovered this theory by using the most advanced information technology to which he was given access. Mandelbrot found out that zooming in closely on a coastline reveals how the length is much longer than it is measured. He believed that a more natural way to describe objects and our world was to use fractals rather than traditional geometry, which is smooth.
After his discovery, he then took his knowledge and discovery and applied it to the real-life world. One of his biggest impacts was on the stock market and identifying subtle patterns of change. Finance models like the Capital Asset Pricing Model (CAPM) assume stock prices follow a Normal Distribution (Bell Curve). This shows that massive crashes in the market are so unlikely to happen that it should only happen once every “billion years”. This was a famous claim made by Mandelbrot. However, Mandelbrot discovered that Market data proves that something called “fat tail” (kurtosis). In statistics and probability, the “fat tail” refers to the amount of a probability distribution for the number of crashes to happen more often than the standard Bell curve would predict. This is linked to his discovery of fractals because of the new point of view he developed. A fractal is a geometric shape that repeats its structure at different scales. Mandelbrot saw that cotton prices and other commodities follow a “scaling law”. The daily fluctuation of cotton prices on a monthly or yearly basis. Because of the structure of the data presented across different scales. A single extreme move (the fat tail) isn’t an isolated error. Instead, it’s a fundamental part of a pattern that will appear slowly over time.
Through Mandelbrot’s discovery of fractals, the mathematics, or to be more specific, the geometric world, took a completely different turn. This made hundreds of equations come to life with visual images because of Mandelbrot’s discovery of fractals.
The Mandelbrot Set
The Mandelbrot Set is an iterated pattern which was constructed by an equation: zₙ₊₁= zₙ² + c. This equation has three parts to it. zₙ₊₁ represents the next position of z in the set of numbers. zₙ is the current value of z.
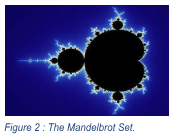
The variable c is a constant number that is added at every iteration. Each time you want to find the value of z, you look at the prior value of z, square it, and add c. An example of a bounded equation is when c is equal to -1. In this example, when the first value of z is zero, the next value of z is -1. As you continue to iterate, the first ten values of z are ⁅0,-1,0,-1,0,-1,0⁆. An example of an unbounded equation is when c equals 1. Doing the same iteration as before, starting with z equal to 0, the first seven values in this set are ⁅0,1,2,5,26,677,458,330⁆. This example shows how, when the value of the constant is negative 1, the equation stays bounded. When c is equal to 1, the equation spirals out of control.
Other Famous Fractals
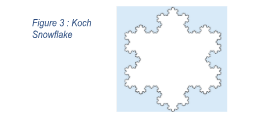
Another famous fractal is the Koch Snowflake. The Koch Snowflake is created with an equation of 3 x 4᪲ = ∞. This example shows how fractals can go to infinity. On the other hand, there is the Mandelbrot Set in which it does not go to infinity nor negative infinity. It remains bounded, it stays within a limit, and never goes to infinity.
Another well-known fractal is the Sierpinky Triangle that consists of equilateral triangles made up of smaller upside-down equilateral triangles inside. The Sirepinksy fractal is named after a Polish mathematician named Wacław Sierpiński. Who describes the pattern as decorative art.
There are multiple ways to get this shape. Starting with the chaos game. The chaos game is a way to create fractals by plotting points based on a random selection of polygon vertices. The Seirpinsky gasket is created by the chaos game by starting out with 3 vertices of an equilateral triangle. You would then pick one of the vertices on the triangle and draw a line segment to the vertex. You then find the midpoint of the line segment. Repeat this process. With our midpoints, connect them with a line segment. Repeating this process with finding the midpoint of each line segment and connecting them with another line segment creates the Sierpinski gasket.
What you can also create with the removal method is the Seirpinsky Gasket. Start with a simple equilateral triangle and connect middle points on the sides to get smaller triangles to form four smaller triangles. Then remove the center triangle, and repeat the process indefinitely. However, the removal method can’t be used to make every fractal. For example, the Koch Snowflake cannot be made by the removal method. This is because the Koch Snowflake is made by adding lines that create equilateral triangles. The triangles then get iterated in different ways to create a snowflake-like shape. This is called recursive iteration. When looking from afar, these fractals look like random shapes. When looking closely, you start to notice how there are different patterns for each one, and you can see how they are formed.
Aside from the famous Mandelbrot set, many other sets have been discovered over time that each has its own unique pattern. Much more than will be included today. And each fractal has its own purposes and uses that go along with its pattern.
Fractal Curves
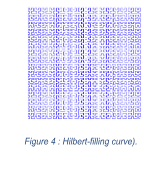
When you first look at a fractal curve from far away, you would think that it is all just one big shape. However, when you get closer and closer, you find that there are repeating patterns shown in the shape in different scales. For example, if you look at Hilbert’s Curve, you would see that it is a square, space-filling curve. When you start with the original curve, a U-shape, that curve gets iterated in different ways. This example of Hilbert’s Curve, which is shown, creates a square in which all of the space is filled, leaving no gaps. Therefore, it is a space-filling curve.
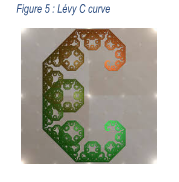
Another example of one of the many fractal curves that go way beyond space-filling curves is the Lévy C Curve. The Lévy C Curve is a different type of curve, where instead of starting with a U-curve. It starts with a c-curve. The Lévy C Curve is a self-similar self-crossing fractal. The Lévy C curve is considered a De Rahm type of curve. This curve was studied intensely by Ernesto Cseàro in 1906 and Georg Faber in 1910, but now bears the name of French mathematician Paul Lévy, who was the very first to describe its properties of self-similarity. As well as proving evidence of its geometrical structure, showing it as a representative curve. Often being put in the same class as the Koch Curve. Fractal curves come in many different categories that were each discovered by hundreds of mathematicians studying the beauty of geometry and complex order in the midst of chaos. These curves are the connecting pieces between the world of abstract theory and nature. Hilbert, Lévy, and so many more mathematicians show that math is so much more than equations on paper, but rather complex visuals scattered all around.
Fractal Dimension
Imagine a shape that is too “wiggly” to be a simple line, but too “thin” to be a full square. Often known as the Hausdorff dimension. It’s like a 1.5D shape. That’s the fractal dimension. Fractal dimension expresses how details can change with scale. It often results in a non-integer value. Showing that structures can be much more complex than a line but less than a plane. Such as the ~1.26 dimension of the Koch snowflake.
The Scaling Formula:
This formula shows the relationship between the size and shape.
![]()
N = The number of new pieces you get after shrinking.
S = The scale factor, how much smaller did the pieces get
D = The Fractal dimension
The Logarithm formula (The calculation):
In this formula: ![]()
N = The number of new pieces you get after shrinking.
S = The scale factor, how much smaller did the pieces get
D = The Fractal dimension
A log is a short way of saying logarithm. A log is the opposite of an exponent. An exponent tells you what you get when you multiply a number by itself; a logarithm tells you how many times you have to multiply it.
Now, using the Logarithm formula, we can calculate many fractals; one of the most well-known is the Sierpinski triangle. When you create a fractal, you take a triangle and shrink it down so the sides are ½ the length before. When you do this, you can fit three small triangles into the original shape.
- Identify the variables-
N- 3 (3 triangles can fit into the original triangle)
S: 2 (Because the length got cut down by ½)
2. Use the logarithm formula:

D = log (3)/ log (2)
3. Solve with a calculator, and you get 1.58 as the dimension of the Sierpinski Triangle. This number proves that the Sierpinski Triangle isn’t just a simple number. Rather more complex than a 1D line (dimension 1.0), but doesn’t quite fill up a 2D plane (dimension 2.0). Instead, its “roughness” sits right in the middle.
While fractals may seem like abstract mathematical concepts, they are fundamentally woven into the fabric of real life and ways you can’t imagine, affecting everything from your biological health to the technology you’re reading from right now.
How Fractals Affect Real Life
Fractal geometry provides solutions for modern engineering challenges where space is limited and tight. Thanks to fractal antenna designs, your daily phone and computer don’t have an antenna poking out of them. By bending an antenna into a self-similar fractal shape, engineers can fit a very long and effective wire into a tiny space inside the phone. This allows the device to pick up signals and frequencies. Modern phones can connect to cellular networks, wifi routers in your home, GPS, and Bluetooth headphones because of fractal antennas. These networks are on different frequencies and can connect because fractal antenna companies created fractal antennas for connecting multiple different networks from one antenna in your device. This same thing is true with modern cars. Cars come with shark fin-like antennas and function the same way as modern phones. They also connect to AM/FM radios, satellites, cellular networks, and GPS.
Another example is computer graphics and compression. Blockbuster movies use fractal algorithms to create hyper-realistic natural scenery like rain, mountains, clouds, and trees. Fractals can also be used in data compression to reduce large image files to smaller sizes without losing any details.
Fractals in Nature
In nature, when you look at a tree, you would see the trunk of the tree, the large branches, and think that’s the end. Trunk to large branches. However, in reality, it all starts from the roots from which the trunk comes.
You see large branches, but if you look closely, you see branches growing off the branches, and this goes on until leaves start to grow. This is called statistical self-similarity. Statistical self-similarity is when there is a pattern to be followed, and it is, but not exactly like self-similarity. This pattern is seen in human anatomy, too!
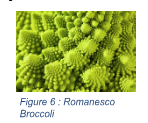
Plants like ferns are designed to have their branches in a way that catches most sunlight without blocking the other leaves from the sunlight. A famous example of this is the Romanesco, an example of a fractal being all around you. broccoli, where each floret is just a mini version of the head, flowing in a spiral pattern.
This “roughness” of an animal’s movement path is often measured by its fractal dimension.
Predators: High-performing predators, like seabirds, use fractal “Lévy Flights.” It was a mix of many short moments to find food in unpredictable moments that the average human can’t handle. This method is much more efficient than a random walk for finding prey. Prey: Many animals use fractal-based camouflage, like a zebra’s stripes, or a cheetah’s spots, to blend seamlessly into complex fractal backgrounds in nature. Diseases Detection: In veterinary medicine, doctors will often use fractal analysis of retinal blood vessels that can identify anything abnormal, like diabetic retinopathy. Monitoring the fractal complexity of an animal’s movement and behavior can reveal hidden health issues. A reduction in average behavior can be a sign of aging, chronic stress, or parasitic infection. In healthy animals, breathing and heart rate rhythms produce fractal fluctuations. Veterinarians can use this to detect that a completely random rhythm is often a sign of system failure or disease.
Fractals in the Human Anatomy
In the medical field, fractals play a big role. For example, they help in biological efficiency and health. Fractal structures are nature’s way of maximizing efficiency within limited space. Lungs and blood vessels are significantly tied to fractals. Your lungs use a fractal branching pattern to maximize the surface area in exchange for exchange. Similarly, blood vessels branch out in a fractal way to make sure every single cell in your body receives an equal amount of nutrients efficiently. Neurology also plays a significant role in how fractals affect biology. Neurons and cells in the brain are organized in a fractal-like network. These organs and cells help the human body function and live; however, they have a bigger role than just helping the human body. In the animal kingdom, fractals are the fundamentals for design principles for efficacy and more. Doctors often use fractal analysis to detect and diagnose diseases. Healthy blood vessels follow an orderly fractal pattern. Whereas cancer cells and growths often appear as animal cells and in irregular clusters. Making it easy to spot the difference and quickly diagnose a patient.

Respiratory Specialization:
Over millions of years, animals have evolved different fractal lung complexities based on their metabolic needs and environments. For example, animals with intense oxygen demands, such as horses, dogs, and cheetahs. Have the highest fractal dimensions to support high-speed movement and running. These are examples of mammal adaptations. However, marine adaptations are run by a completely different system. For instance, dolphins possess fractal lung structures that are designed for
Conclusion
While fractals were once dismissed as mathematical messy monsters or mere curiosities often forgotten about, they impact modern telecommunications, medical diagnosing and imaging, and engineering, and have already proven their unmistakable utility. As we continue to find and decode these self-similar patterns, our ability to interface complex digital systems and problems will only strengthen. The future of technology, engineering, and design lies in not fighting the complexity of the world we were born into, but rather controlling and understanding the fractal and mathematical logic that lies behind it. By understanding and taming the complexity, we get to see the structure and harmony of the world around us and the world being built on us today. Waiting for the future generations to explore more and more through fractals.
Works Cited
Fractal Foundation. “What Are Fractals?” Fractal Foundation, https://fractalfoundation.org/resources/what-are-fractals/.
“Fractals: Introduction.” Mathigon, https://mathigon.org/course/fractals/introduction.
“Top 5 Applications of Fractals.” University of Waterloo, https://uwaterloo.ca/math/news/top-5-applications-fractals.
“The Geometry of Cancer Cells.” Max Planck Society, https://www.mpg.de/7647926/cancer-cell-fractal.
“Fractal Dimension.” Boston University Department of Mathematics and Statistics, https://math.bu.edu/DYSYS/chaos-game/node6.html.
Fractal Foundation. “Fractal Bodies.” Fractal Foundation, https://fractalfoundation.org/OFC/OFC-1-3.html.
“Mandelbrot Set Zoom.” Mandelbrot. site, https://mandelbrot.site/.
Mandelbrot, Benoît B. The Fractalist: Memoir of a Scientific Maverick. Academia.edu, https://www.academia.edu/6383407/The_Fractalist_Memoir_of_a_Scientific_Maverick.
“Benoît Mandelbrot.” IBM, https://www.ibm.com/history/benoit-mandelbrot.
“Fractals.” Stanford University, https://web.stanford.edu/class/archive/cs/cs106b/cs106b.1186/assn/fractals.html.
“Fractal Antenna Technology Overview.” Fractenna, https://www.fractenna.com/our/antennatech.html.
“Fractal Antenna Technology Overview.” Fractenna, https://www.fractenna.com/our/antennatech.html.
“Lévy C Curve.” Wikipedia, Wikimedia Foundation, https://en.wikipedia.org/wiki/L%C3%A9vy_C_curve.
Fractal Foundation. “Of Fractals and Chaos (OFC) 5.5.” Fractal Foundation, https://fractalfoundation.org/OFC/OFC-5-5.html.
“Our Bones’ Strength, Flexibility and Fractals.” The Science Breaker, https://www.thesciencebreaker.org/en/breaks/maths-physics-chemistry/our-bones-strength-flexibility-andfractals.
YouTube videos
“What Are Fractals?” YouTube, uploaded by [MITK12Videos], https://www.youtube.com/watch?v=WFtTdf3I6Ug.
“What Are Fractals for Nature?” YouTube, uploaded by [Be Smart], https://www.youtube.com/watch?v=ipj8roHcWnU.
“Fractal Patterns.” YouTube, uploaded by [Popular Science], https://www.youtube.com/watch?v=2tr830AKnOo.
“Why Trees, Rivers, Blood Vessels, Rivers, and More Seem Similar.” YouTube, uploaded by [Be Smart], https://www.youtube.com/watch?v=ipj8roHcWnU.
“Fractals Are Typically Not Self-Similar.” YouTube, uploaded by [3Blue1Brown], https://www.youtube.com/watch?v=gB9n2gHsHN4.